Like all analytics, attribution measurement methodologies are constructed with a specific purpose in mind: to answer a precise research question. While they do a great job of being fit for their unique purpose, it’s common to combine methodologies. This helps you get the multiple perspectives needed to direct improvements to your marketing planning.
We’ll outline three widely understood and applied approaches to attribution:
- Multi-Touch Attribution (MTA)
- Media Mix Modeling (MMM)
- Incrementality Measurement
We’ll explore how they work, the challenges they solve, their limitations, and how they can be used together to achieve a comprehensive view of marketing effectiveness.
Multi-Touch Attribution (MTA)
Multi-Touch Attribution (or MTA) is by far the most commonly understood and attempted attribution methodology. Often referred to as ‘click’ attribution or customer journey analytics. As the name suggests, MTA focuses on ‘touches’ or ‘engagements’ that have been measured as a direct result of a channel. These events are collected based on the purpose of the activity and what it’s been built to drive. As signals are collected, they’re weighed up against the KPIs that were set as the success metric for the activity. They are then interpreted alongside other signals from channels that aim to drive a similar outcome.
If it sounds messy, that’s because it is.
MTA enforces a need to be clear about the purpose of the activity upfront. It means multiple channel collection methodologies and a clear framework for interpretation. Many assumptions about the customer journey are often necessary.
This also means a high investment when combining multiple platforms and channels. Investment in the development of the methodology upfront, engineering, and maintenance to ensure data dependability of event collection. Further investment also needs to be made in the interpretation and translation of the model, to ensure the right insights are being used to guide future decisioning. And after all that, there’s a need to be ready to adapt at any moment, at the mercy of algorithm updates and platform changes to channels.
“MTA is the easiest attribution method to dabble in, while being the hardest to master.”
It’s not all struggle street though. While the investment of MTA is significant (and only becomes more complex as the number of channels initiated scale), it’s also the fastest attribution method of the three. It’s simplest to action on an individual channel level, making it possible for anyone to jump in and ‘dabble’ in self-service platforms.
Platforms are inherently incentivised to continuously improve their attribution modeling so that we’ll see the value they provide and increase our investment. The upside of this means we can quickly get a read on signals within the platform analytics which help us to tweak and optimise performance. The downside is understanding the method they apply to their (often black box) measurement approach and aligning these signals alongside other platforms to derive a holistic meaning. But that’s where MMM comes in, which we’ll cover next.

Media Mix Modelling (MMM)
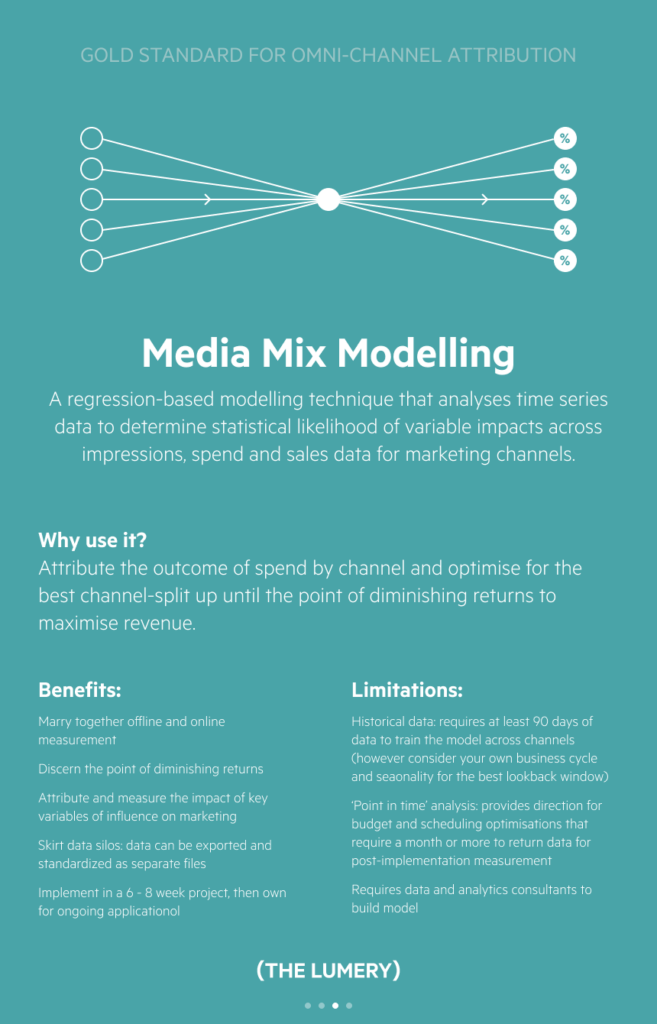
Media Mix Modelling or MMM is a regression-based statistical modelling technique that compiles impression (or reach), spend, and sales (or revenue) data with key variables of influence. Variables of influence could include seasonality, employment, retail events, product launches, and any number of other possible influences that might impact the success or failure of marketing campaigns.
The output offers a top-down, birds-eye view of the marketing mix, including the ROI of each channel, the point of diminishing returns, and most importantly — the direction for reallocation of spend.
Unlike MTA, MMM manages to skirt around a lot of the complexity in attribution by standardizing measurement across all channels. That yardstick for measurement across all channels is impressions (or reach) as opposed to MTA’s “touch” or “click” metrics which often vary in their specific definition depending on the channel and collection method.
This also means that we can include and measure the impact of channels that sit higher in the funnel, like TV and radio.
“MTA makes this tricky due to the requirement to stitch together digital signals i.e. the action a prospect takes while MMM measures any presence.”
It’s for this reason I’ve always personally had a problem with using MTA in isolation. Measuring “first touch” digital signals aren’t ever really “first touch” in a holistic sense — since offline channels fall into the MTA measurement void. As a result of this, and as digital platforms became ubiquitous, digital signals have in many ways offered specialist marketers a convenient scapegoat for measurement.
When the measurement conversation shifts to: “Well they saw this ad on their journey to convert,” or even a direct conversion — “They saw this ad and then clicked and checked out” … Who is to say we didn’t just intercept and pay for a customer who would have purchased anyway?
This is where MMM can provide us with another perspective. While it won’t measure intent ( we’ll get to that later), MMM does offer a method for marrying together offline with online for true omni-channel measurement.
It’s not without its own limitations though.
MMM demands the need for a data team. It also demands a certain level of historical data so the model can be trained to predict a better outcome.
“Looking back will only ever tell you whether the decisions you made yesterday were good ones. Look back to look forward.”
Since it’s regression-based, it will only ever tell you whether the decisions you made yesterday were good ones. So the allocation of ROI and simulated returns assume you’ll adopt the same strategy. No one has a crystal ball, but MMM gets close with its prediction engine, providing you don’t have plans to overhaul your media mix and approach. If you do, you’ll need to reduce your appetite for certainty anyway since “innovation” assumes you’re embarking upon a new journey that hasn’t been measured yet!
That’s when you need to call me so we can chat propensity modelling and predictive analytics…

Now — you’re probably starting to get a sense of how layering the three methods together start to paint the comprehensive picture we need to make our best decisions at every layer.
The question becomes; how do we measure customer intent and persuade the business that our efforts resulted in a change in behaviour? Convince them that if they didn’t invest in the activities we did, we wouldn’t have generated the returns we saw?
Enter, Incrementality Measurement.
Incrementality Measurement
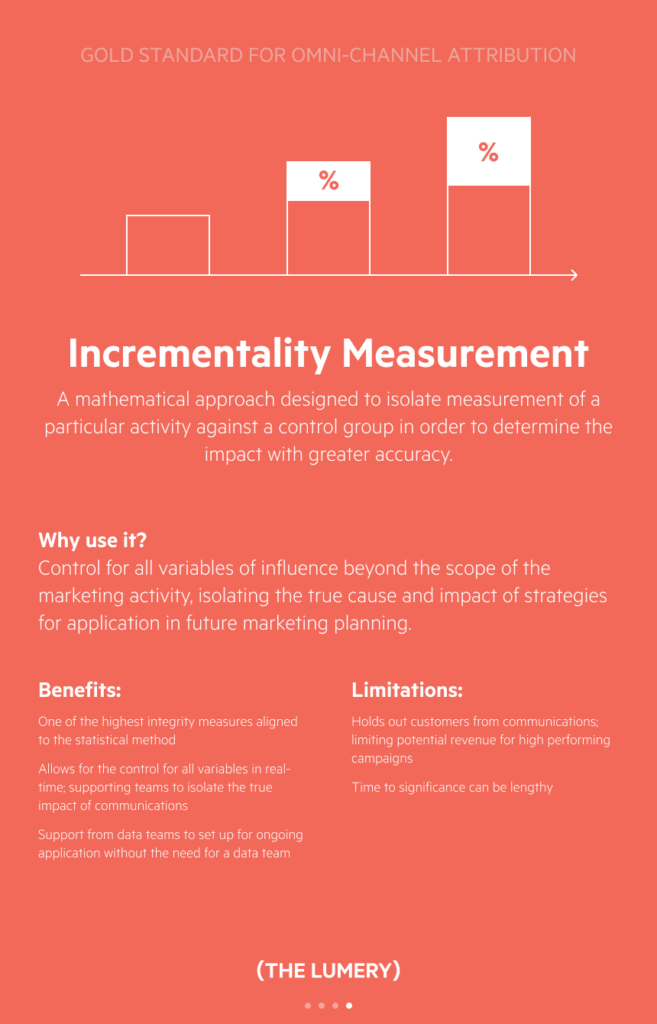
Incrementality Measurement also referred to as “Conversion Lift” or “Control Experimentation,” or “Holdout Group Analysis” is a mathematical approach. It’s designed to isolate the measurement of a particular activity against a control group, in order to determine the impact with greater accuracy.
In a marketing sense, Incrementality Measurement allows us to measure our strategies with a higher degree of integrity. By truly discerning whether we changed behaviour above and beyond what would have happened if we had done nothing.
It achieves this through setting up a “control group” of individuals who are withheld from particular activities. The group is measured independently to determine a new baseline of individuals who acted (or didn’t) without any intervention or influence. This baseline is not zero, but a specific representation of the variables in-market at the time. It also offers a marker for ‘intent’ which both MTA and MMM can’t offer. And whether marketing can take any credit for influencing the customer journey if we just so happened to intercept them as they were going to take action anyway.
There’s a lot of integrity in that. After all, this statistical methodology forms the basis of the scientific method, so it’s difficult to argue with the value that marketing brings an organisation when this method is the standard.
The problem? When results are good, you suffer the hangover of recalling that they could have been better if only we hadn’t “held out” customers from a particular offer or activity. On the flipside, when results are poor, you’ve saved a small group from being deterred on their journey to act.
One of the other limitations to Incrementality Measurement is the need to reach statistical significance, in order to make a determination that an activity performed better than the control, to a meaningful degree. There’s a structured method to this process, however, the impacts on the marketer are mostly of time, which subsequently slows the rate of improvements that can be made to drive growth (and meet your targets)!
A layered approach is best.
At its core, Incrementality Measurement is used to control for variables and measure a change.

Conclusion
While all three primary attribution models help to bring visibility to marketing effectiveness, layering them provides perspective from a variety of angles. You’ll bring a comprehensive view of the whole while directing specific strategic direction and tactical needs to progress growth.
All three vary in complexity, the baseline requirements to get started, and the skills needed to set up and maintain success.
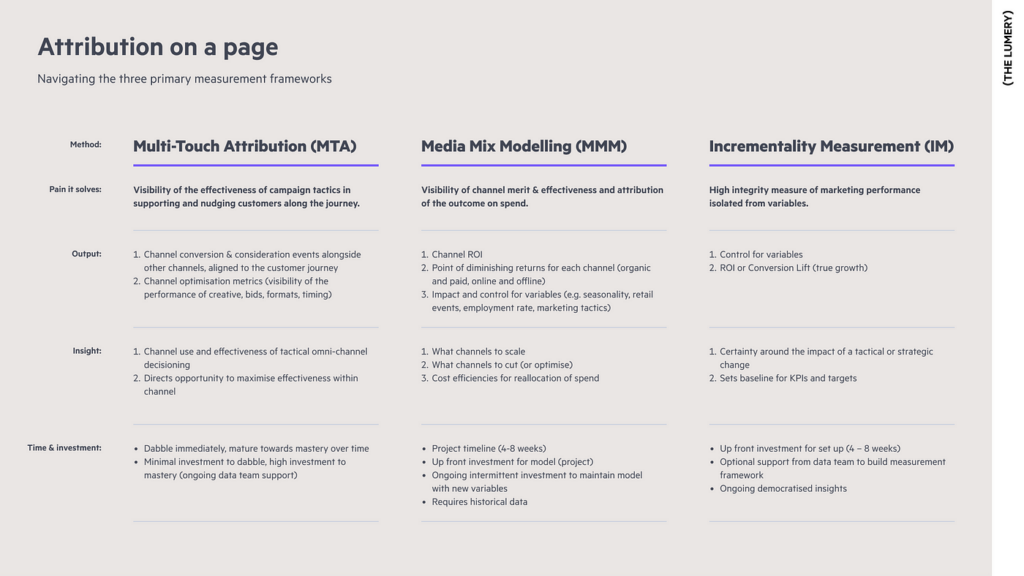
Want a handy reference sheet? Refer to the summary sheet below to get a steer on where you should start your attribution journey. Or speak to a member of our team to discuss your attribution needs today.
